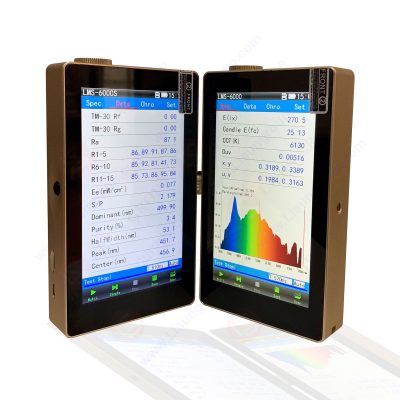
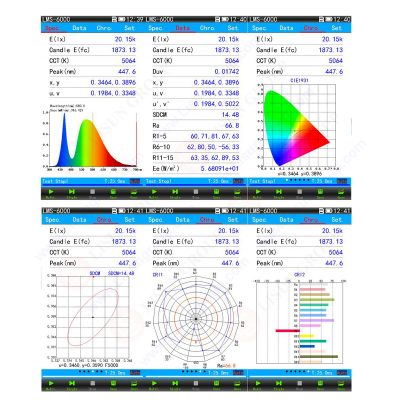
Light-emitting diodes are not just a simple turn-on and turn-off mechanism. In addition to simply emitting a white light, LEDs also have the ability to emit thousands of shades. The characteristics of light color and intensity are called chromaticity, and this indicator is important to both LED manufacturers and consumers. Before the product goes on the market, the importance of measuring the chromaticity of the LED is particularly important.

LMS-6000 Portable CCD Spectroradiometer
What is color model?
Let us first consider the color model and how we define the color space. We operate according to the principle of subtraction or addition, and combining all the primary colors together will produce white or black. The printer works in a subtractive color model, commonly referred to as CMYK, which represents the four inks used by most printers: cyan, magenta, yellow, and key (black). Theoretically, cyan, magenta, and yellow combine to form black, although most inks produce a turbid dark gray and rely on special black inks. In order to measure the light of objects such as televisions or computer monitors, people use the RGB model. Here, the three main light colors—red, green, and blue—combine to form white.
Although useful in many applications, the limitations of the RGB model led to the creation of another additive model based on light: hue, saturation, and brightness, or HSB (some people prefer HSV, “value” stands for “brightness “). Hue is related to two of the parameters: hue and saturation. They respectively quantify the color and intensity of light. Because light cannot move along the luminance axis from white to black, this parameter is ignored in chromaticity measurement.

Color Model
Why need to do the Chromaticity?
Part of the magic of LEDs is their versatility. Because they don’t appear in just one kind of white, LEDs can come in a variety of colors across the hue/saturation space, as well as different tones within what we would refer to in layman’s terms as “white light.” LEDs can replicate the warm whites of incandescent bulbs, the cool whites of fluorescents, and the natural appearance of sunlight. The importance of measuring LED chromaticity rises as we convert the last of our incandescent lights to LEDs. Cool white bulbs are a poor fit for most living rooms. To deliver LEDs that illuminate as advertised, manufacturers must test their LEDs to meet specifications. LEDs that don’t have reliable chromaticity standards will disappoint consumers and cost companies money.

Portable CCD Spectroradiometer Test Report
Performing the Tests
Regarding as the market requirement, LISUN design different model of LMS-6000 series spectroradiometer to full meet different test requirement. And its fully meet CIE 177, CIE-13.3 , Optical-Engineering-49-3-033602, and IEEE.
| LISUN Model | Function | Wave Range |
| LMS-6000 | illuminance (lux), E(Fc), Ee(W/m2), Tc (K), Duv Correlated Color Temperature (CCT), Chromaticity Coordinates, CRI, Purity, Peak Wavelength, Dominant Wavelength, Half Bandwidth, Center Wavelength, Centroid Wavelength, Total Color Difference, Brightness Difference, Red-Green Degree, Yellow-Blue Degree, CCT Difference, SDCM Diagram, Spectrum Diagram | 380-780nm |
| LMS-6000B | LMS-6000 Parameters+Blue Light Hazard Weighted Irradiance according to GB/T20145, CIE S009/E:2002 | 380-780nm |
| LMS-6000BF | LMS-6000 Parameters+Flicker test, Blue Light Hazard Weighted Irradiance according to GB/T20145, CIE S009/E:2002 | 380-780nm |
| LMS-6000F | LMS-6000 Parameters+Flicker test | 380-780nm |
| LMS-6000L | cd/m2, fL, Tc (K), Duv Correlated Color Temperature (CCT), Chromaticity Coordinates, CRI, Purity, Peak Wavelength, Dominant Wavelength, Half Bandwidth, Center Wavelength, Centroid Wavelength, Total Color Difference, Brightness Difference, Red-Green Degree, Yellow-Blue Degree, CCT Difference, SDCM Diagram, Spectrum Diagram | 380-780nm |
| LMS-6000P | LMS-6000 Parameters+PAR, PPFD, YPFD, Blue-purple irradiance Eb, Yellow-green irradiance Ey, Red-orange irradiance Er, Ratio of red and blue radiation Erb_Ratio | 380-800nm |
| LMS-6000S | LMS-6000 Parameters+PAR, PPFD, YPFD, Blue-purple irradiance Eb, Yellow-green irradiance Ey, Red-orange irradiance Er, Ratio of red and blue radiation Erb_Ratio, Rf and Rg according to TM-30 | 350-950nm |
| LMS-6000UV | UV-A, UV-B, UV-C and UV total Radiant Irradiance, UV hazard irradiance, UV spectrum, Dominant Wavelength, Peak signal, Start wavelength, End wavelength. Please click here to see the LMS-6000UV Test Report. | 200-400nm |
| LMS-6000SF | LMS-6000 parameters+Flicker+Plant Lighting parameters+TM-30 | 350-950nm |
| LMS-6000I | Input and Output Control via RS485 | 380-780nm |
| LMS-6000C | LMS-6000 parameter without PC software | 380-780nm |
Lisun Instruments Limited was found by LISUN GROUP in 2003. LISUN quality system has been strictly certified by ISO9001:2015. As a CIE Membership, LISUN products are designed based on CIE, IEC and other international or national standards. All products passed CE certificate and authenticated by the third party lab.
Our main products are Goniophotometer, Integrating Sphere, Spectroradiometer, Surge Generator, ESD Simulator, EMI Receiver, EMC Test Equipment, Electrical Safety Tester, Environmental Chamber, Temperature Chamber, Climate Chamber, Thermal Chamber, Salt Spray Test, Dust Test Chamber, Waterproof Test, RoHS Test (EDXRF), Glow Wire Test and Needle Flame Test.
Please feel free to contact us if you need any support.
Tech Dep: Service@Lisungroup.com, Cell/WhatsApp:+8615317907381
Sales Dep: Sales@Lisungroup.com, Cell/WhatsApp:+8618917996096
Your email address will not be published. Required fields are marked *